ABOUT PAULA
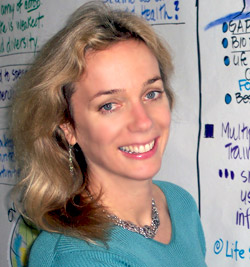
As a graphic recorder and facilitator, Paula Hansen creates compelling visual displays to help groups engage and create together. She has over fifteen years of experience working with a range of organizations from Fortune 100 companies to start-ups and non-profits, She has worked throughout the US and all over the world, from China, India and Nepal to Iceland, Denmark and Australia.
Paula received her training at The Grove Consultants International in San Francisco, leaders in the field, where she worked for seven years and is currently an Associate.
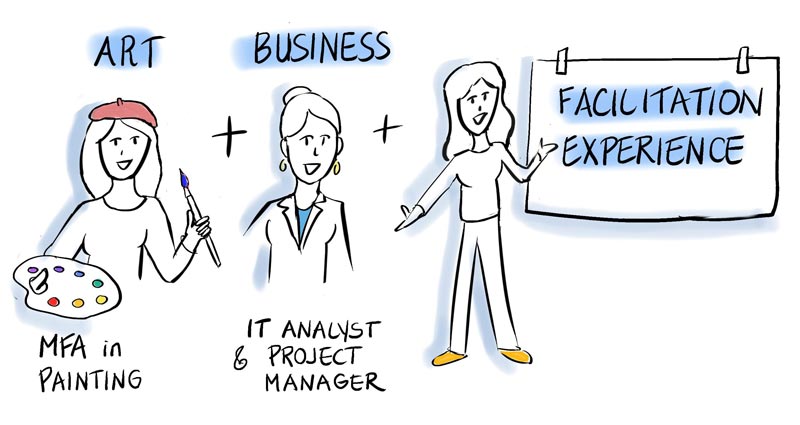
Paula brings unique qualifications to her work, including a strong “right brain-left brain” balance. Her background in business and technology enhances her capacity to serve clients. She has a BA in Mathematics and Art from Hamilton College in Clinton, NY and a Masters of Fine Arts in Painting from the Maryland Art Institute in Baltimore. Before discovering graphic recording, Paula worked for many years in the IT field as a Systems Analyst and Project Manager for Booz, Allen & Hamilton, IBM and Siemens. Additionally, she has studied psychology and group process in a range of settings.
Paula is continually inspired and excited by the spark of understanding and engagement that graphics bring to meetings!
ABOUT GRAPHIC FACILITATION
Graphic Facilitation is the real-time capture of your meeting content on wall-size charts using words and pictures. When you bring the power of visual communication to your event or project, you can expect great results:
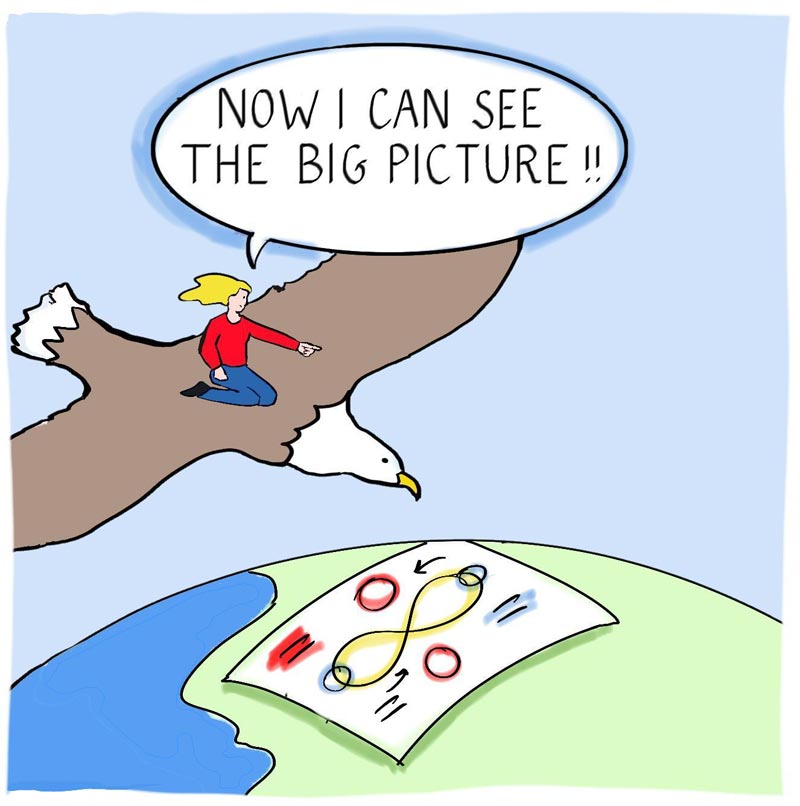
Promote Big Picture thinking
Working on large-format charts allows the entire span of conversation to be viewed at once, and promotes reflection and insight. People recognize relationships and patterns when they can see content as a whole.
Visuals can be used to synthesize complex information into a clear, compelling message..
Fully engage participants and foster alignment
Graphic displays help people focus, track and engage in the conversation, which fosters alignment. People feel validated and acknowledged when their ideas appear in the public record for all to see.
A visual record of the group conversation makes brainstorming more efficient and accountable.
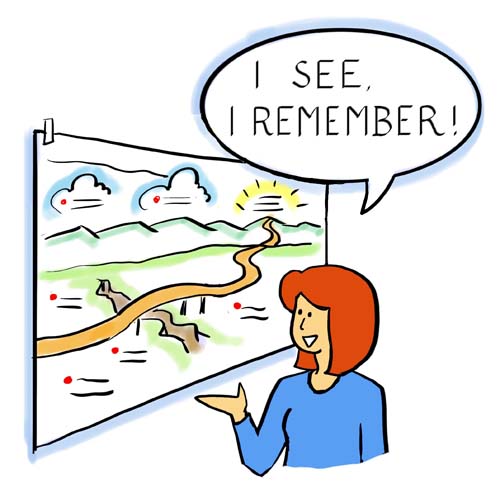
Optimize learning
Learning and retention increase when multiple senses are engaged. Studies have shown that retention increases by 40% when visuals are added to auditory input.
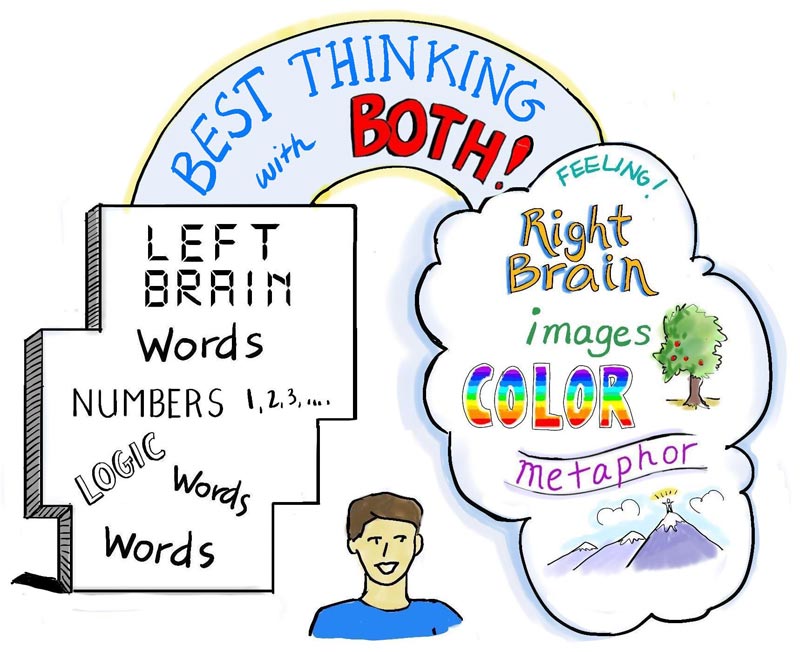
Stimulate creativity and promote ‘whole brain’ thinking
Words are processed by the left brain; images, colors and metaphors engage the right brain. People do their best creative thinking when both hemispheres are firing.
Graphic facilitation awakens the right brain, sparking creativity and fostering an environment of fun and learning
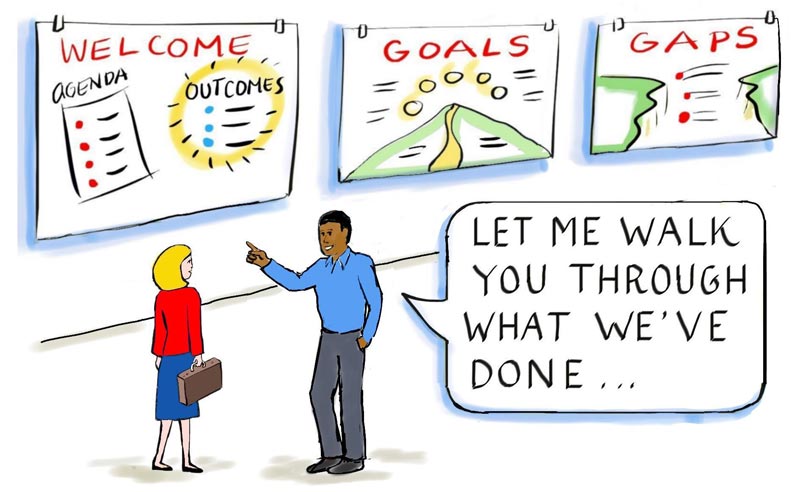
Provide group memory
Graphic displays serve as an effective touchstone for reviewing accomplishments and can be used to quickly bring team members up to speed.
Creating a visual group history for team building or project kick-offs helps build a shared team story and identity.
Great Meeting Follow-Up
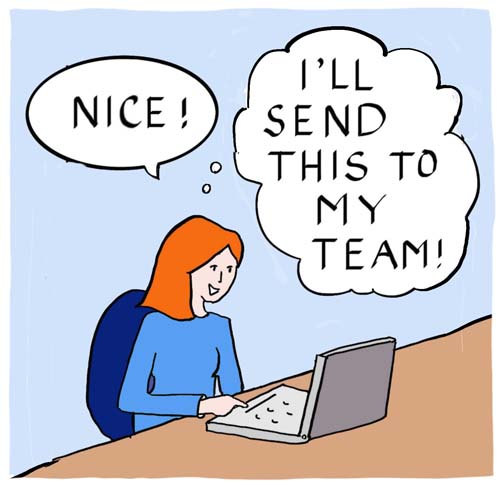
Including charts in follow-up Meeting Reports provides a critical reminder of meeting highlights. A graphic summary of meeting content serves as an engaging touchstone for keeping momentum moving and keeping your message front and center.
You can also share chart images digitally on social media during or after your event to help capture attention.